learn more
accept
background
HighFinesse Logotype
Icon Events Icon All Datasheets Icon Quickfinder Icon Select Language Icon Contact HighFinesse
HighFinesse Logotype
Icon Language EN
中国 English
Button Close Menu
Icon Events Icon All Datasheets Icon Quickfinder
Icon Call HighFinesse

Please select product group
and find your local distributor.

Button Distribution Product Group Wavelength Meter Button Distribution Product Group Spectrometer OSA Button Distribution Product Group Linewidth Analyzer
Button Distribution Product Group Precision Current Sources Button Distribution Product Group Calibration Sources
Button Close Menu

LWA-100k Series

Linewidth Analyzer

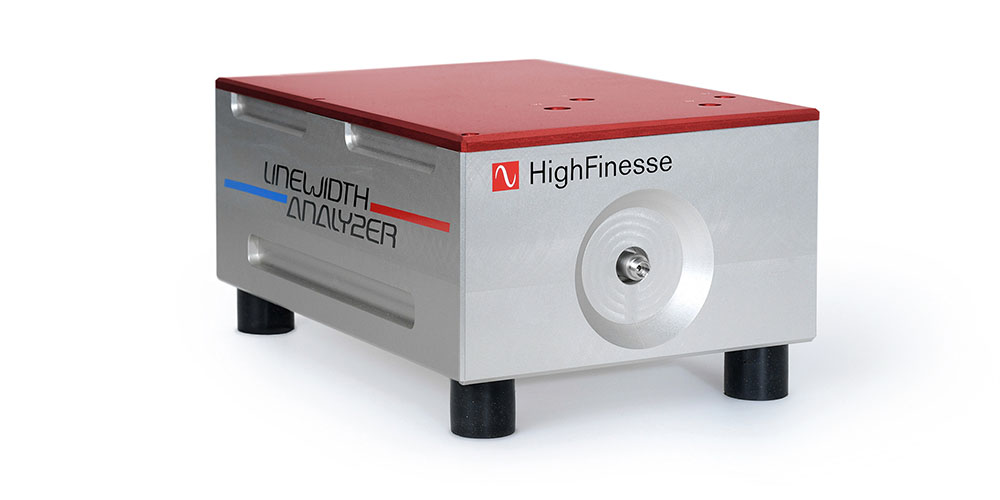
HighFinesse Linewidth Analyzer LWA-100k Series
Icon Measurement Range 380 – 1700 nm

Measurement
Range

Icon Linewidth Range 100 kHz – 300 MHz

Linewidth
Range

Icon Noise Frequency Range up to 10  MHz

Noise
Frequency Range

Icon Real-time Measurement Speed

Real-time
Measurement Speed

Linewidthanalyzer LWA 100k

The versatile LWA-100k analyzes both, narrow laser lines down to 100 kHz effective laser linewidth, as well as broader sources up to 300 MHz. This is achieved by two distinct measurement modes.

.

In broadband mode the effective linewidth is calculated via the broadening of the spectrum of a scanning Fabry-Perot interferometer. In narrowband mode the effective and intrinsic linewidths, as well as the noise density spectra, are derived from the spectrum of the same interferometer by means of a sophisticated algorithm.

Available Measurement Ranges

Icon Measurement Range 380 – 430 nm

LWA 100k 400

Icon Measurement Range 430 – 660 nm

LWA-100k 500

Icon Measurement Range 615 – 885 nm

LWA-100k 750

Icon Measurement Range 825 – 1200 nm

LWA-100k 980

Icon Measurement Range 1200 – 1700 nm

LWA-100k 1550

Demonstration of Broadband-mode

Demonstration of broadband-mode

Demonstration of broadband

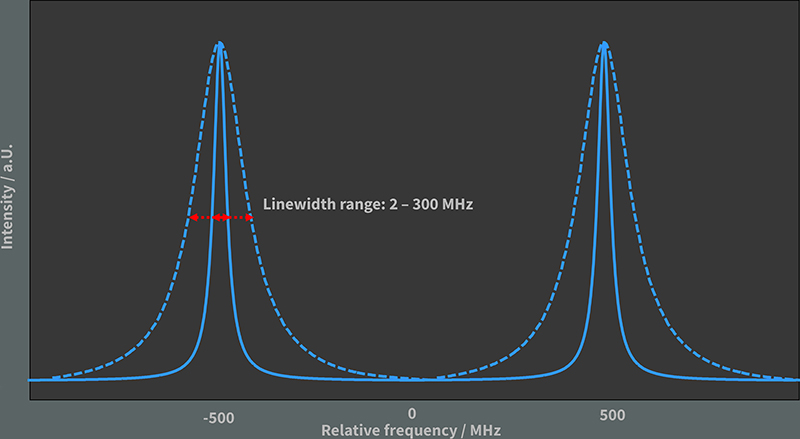
The acquisition in the broadband mode yields an intensity spectrum in the frequency domain with evenly separated spectral bands.

The linewidth is then given by the full width at half maximum (FWHM) of the curve (Lorentzian or Gaussian) fitted to the data. The linewidth range in broadband-mode is between 2 (blue line) and 300 MHz (dashed line).
Demonstration of Frequency Noise Spectrum Evaluation

emonstration of frequency noise spectrum evaluation

Demonstration of Frequency Noise Spectrum Evaluation

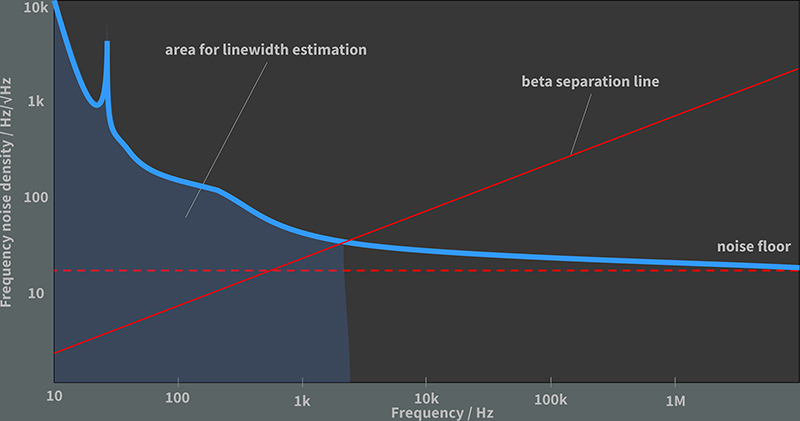
A Fourier analysis of recorded time-domain laser frequency deviation signals yields a frequency noise density plot in the frequency domain (blue line) with 1/f-noise, characteristic noise peaks and a white noise floor.

According to the β-separation method 1), the effective linewidth is proportional to the area of the frequency noise (blue) above the β-separation line (red line). The intrinsic linewidth is given by the noise floor level (in Hz2/Hz) times π (rule of thumb).

1) Di Domenico, et al., Applied Optics 49, issue 25, 4801 – 4807, 2010

Find Local Distributor

Button Distribution North America Button Distribution South America Button Distribution Europe Button Distribution Asia Button Distribution Australia

Further Information

Button Technical Data LWA-1k Button Product Brochure Linewidth Analyzer
Icon Back to Product Finder

Special Requirements?

Don't hesitate to contact our service team for user defined functions or OEM applicactions. We are always open for customers requirements.

contact service team